Avalanche Registers an Uptrend, AVAX Rallying to Form New Highs

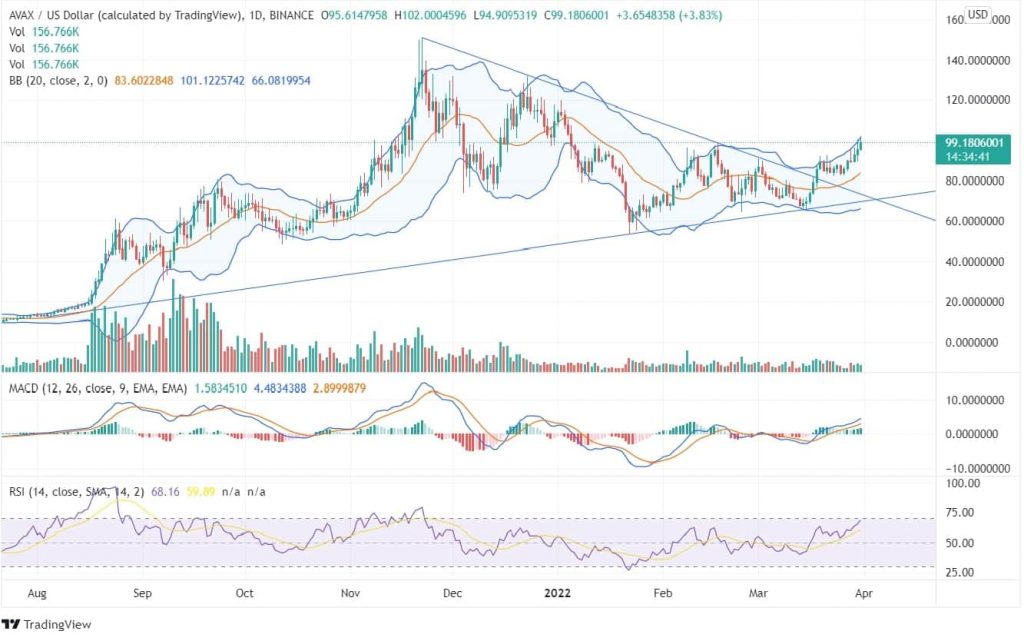
Avalanche shows a price rise from its lows of $65.57 and is currently trading around $99.52. The coin was moving in a downward channel in the past week. The chart shows strong support at $54, and the price is strongly following the trend lines. The forming candle shows a price breakout, which may rally to form a new high. The forming pattern in the daily chart showing the trend lines intersecting and the price breaking above it can indicate the up-trending pattern.

On the daily chart, the MACD line above the signal line indicates a bullish signal. The RSI indicator is 67 currently, which may lead toward an overbought zone. Yesterday, the AVAX price registered a hike of 8%. The bands show volatility in the price movement, and the price is moving close to the upper bands but hasn’t yet closed above them. The volume bar shows inconsistency towards the bears or the bulls as there isn’t much favorable volume. Based on the Avalanche price prediction, if the coin continues to trade with the current momentum, it may cross the crucial resistance of $115 soon.
On the weekly timeframe, the formation of bullish candles from the last three weeks taking the support of the uptrend line can be an indication of bullish momentum. On March 14, there was a formation of a bullish engulfing pattern, and the forming candle has crossed the highs of the recent previous candles. Though the indicators are yet to give a signal in long-term charts, however, the price suppressing the trend line stretching from November and the bulls pushing the price upside can be an indication of upside momentum in the long run.